We use cookies on this site to enhance your user experience
By clicking the Accept button, you agree to us doing so. More info on our cookie policy
We use cookies on this site to enhance your user experience
By clicking the Accept button, you agree to us doing so. More info on our cookie policy
Capturing emission spectra of pyrotechnic compositions with a diffraction grating
Published: Jan 1, 2023 by Roman Dvořák
New Year’s Eve is full of fireworks. People look at the sky and enjoy colors and light. This time, I had no plan I wanted to do something interesting. I had a simple idea. Fireworks are not only light. They are set of interesting elements. Each color comes from a different element. If I can split the light into a spectrum, I should be able to see these elements. So instead of just watching the fireworks, I decided to measure them. I built a simple spectrograph from parts I had or borrowed from my work. The goal was not to build a perfect instrument. The goal was to test if this idea works in real conditions.
The setup was assembled using equipment available to us, allowing to conduct measurement without the need for purchasing expensive gear. This setup was chosen as “the best”, with the idea that it could be simplified for futhure measurement based on this experiences (check observed problems at end of this document).
The following images shows the attaching of a diffraction grating to the camera. Grating was screwed to the end of a C-mount to 1.25” barrel adapter. It ensures constant sensor-grating distance within the optical system.
The experiment took place during New Year’s Eve, from a higher building in Prague.
It was cold. The sky was full of random explosions. Fireworks are difficult targets:
The camera was running at high speed (up to ~1000 FPS). It recorded RAW12 data continuously. Each short recording was large. A few seconds could take several gigabytes. Data was sent directly to a computer over the network. Most of the data is useless. But sometimes, everything works. The firework is in the field of view, the focus is correct, and the spectrum is visible. These frames are the result.
After the night, the real work started. The RAW12 format is efficient, but not easy to use. Two pixels are stored in three bytes. So the first step was conversion.I used a Python script to convert RAW12 files into TIFF images. This process is slow, but necessary. Then I used FFmpeg to create preview videos. This made it easier to search for good frames. You can see these videos here:
After that, I manually selected frames with visible spectra. The analysis was done in a Jupyter Notebook. The workflow was simple and interactive. I selected a line across the spectrum. Then I calculated intensity along this line. Finally, I converted pixel position into wavelength. At this moment, the fireworks stopped being just images. They became data.
To convert pixels to wavelength, I used geometry of the setup.
Important parameters were:
To improve accuracy, I used known light sources:
Calibration works, but it is not perfect. This part needs improvement.
When looking at the spectra, the result is clear. Fireworks do not produce continuous light. They produce lines. Each element has its own pattern:
This confirms that the method works. However, identification is still manual. I do not have a full spectral database yet.
The experiment also showed many problems. Focusing was difficult. The depth of field was very small. Aiming was also difficult. The telescope has high magnification and a narrow field of view. Exposure was another issue. Some parts were too bright, others too dark. The camera also needed time to save data. During this time, new events were missed. All these problems are important. They show what needs to be improved.
The main result is simple. The method works. Even with a simple setup, it is possible to measure spectra of fireworks. The data is usable and shows clear emission lines. But the process is not automated. It still requires manual work.
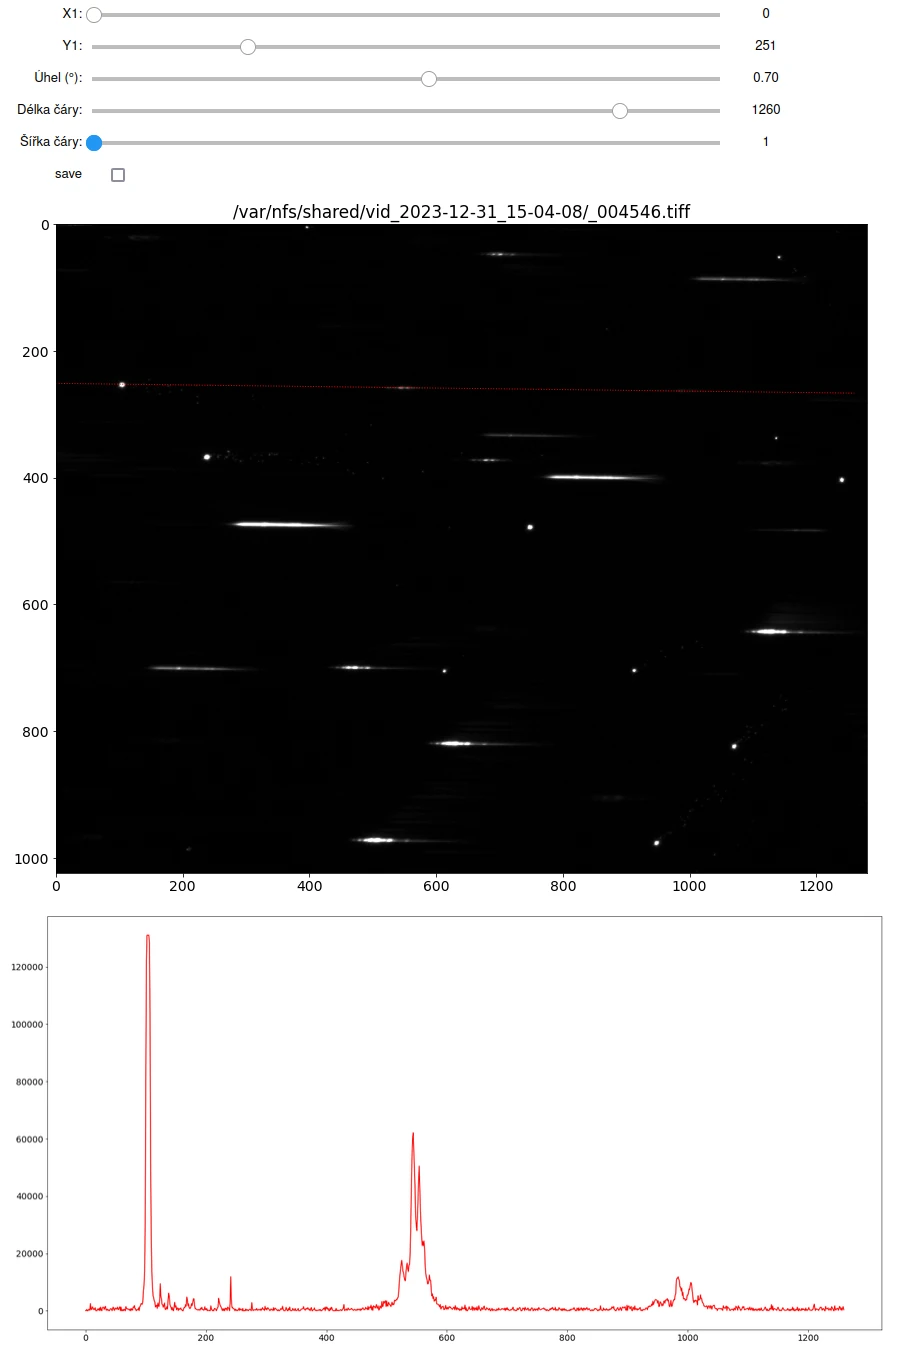
Interactive analysis tool: raw frame with spectral lines (top) and the extracted intensity profile (bottom).
After extracting the intensity profile along the spectral line, the pixel positions were converted to wavelengths using the calibration. The resulting spectrum clearly shows individual emission peaks. The two dominant groups correspond to strontium lines in the red region (~614 nm, ~628 nm) and a strong sodium doublet near 589 nm.
There are many ways to improve the system. Better aiming would help a lot. Maybe a tracking mount. Better diffraction grating would improve resolution. Faster data handling would reduce missed events. Better calibration is also needed. And finally, a spectral database is required for automatic identification.
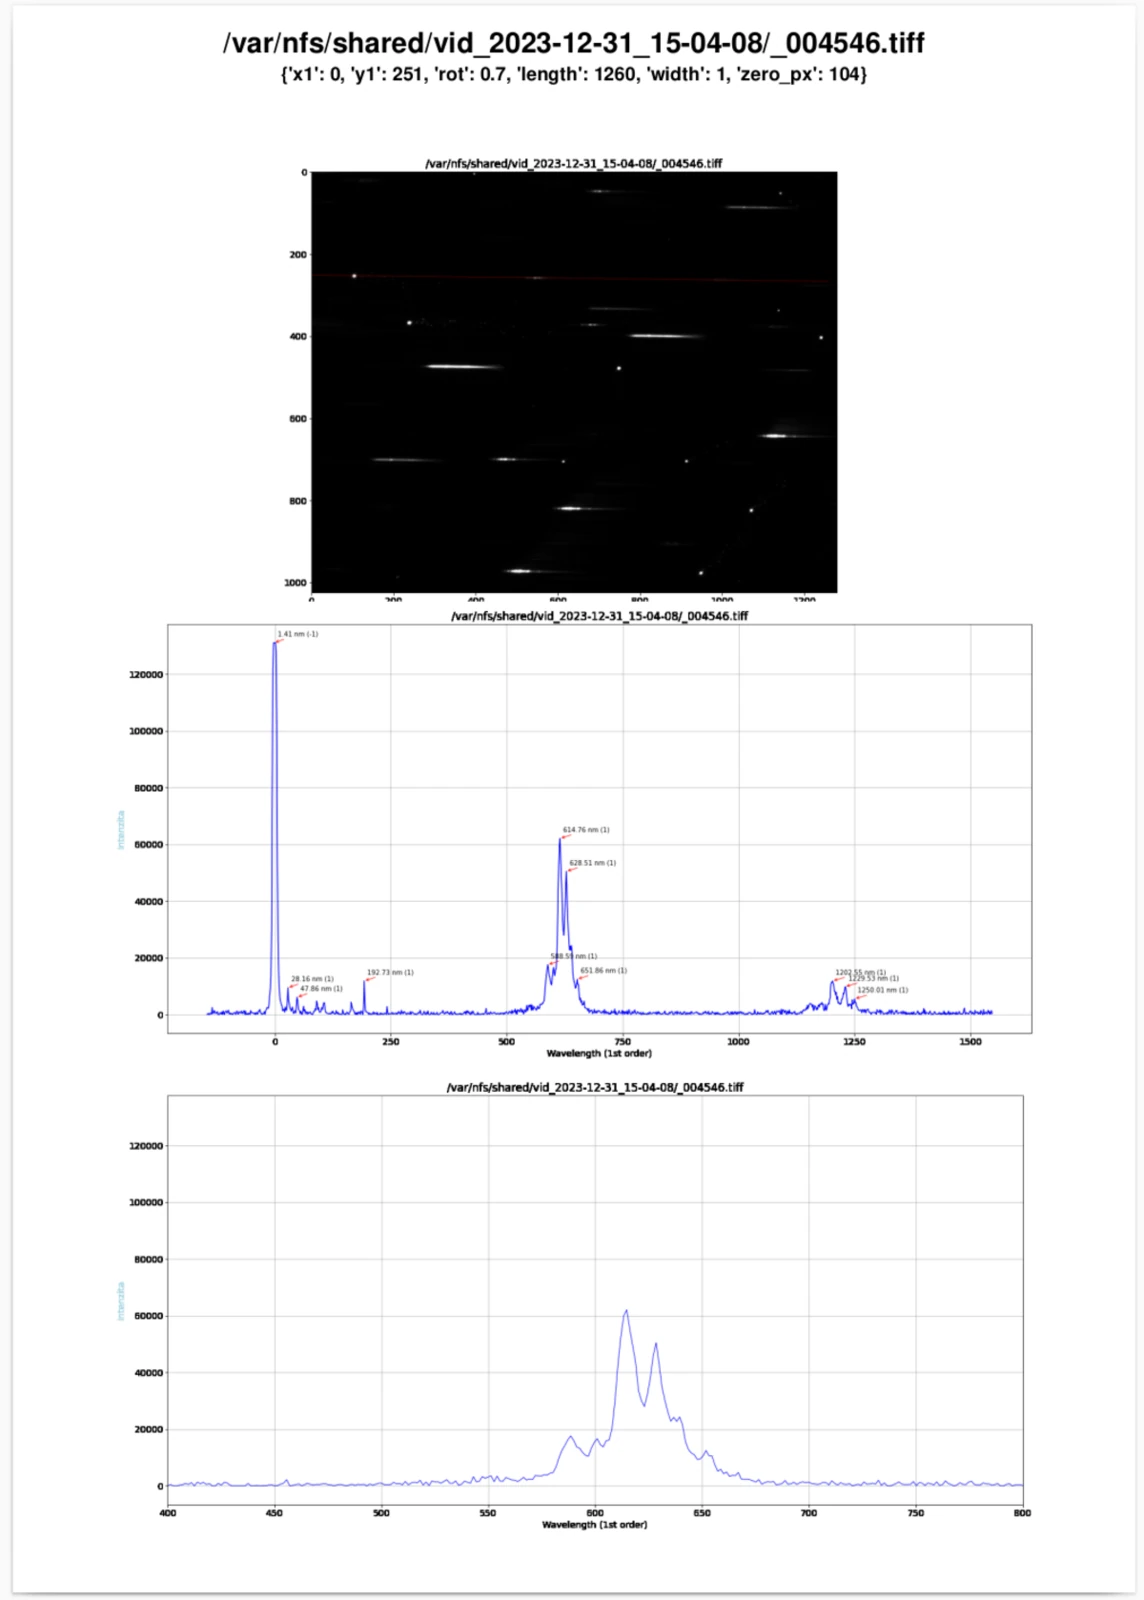
Calibrated spectrum with labeled emission lines — visible peaks correspond to barium (green) and strontium (red) emission lines.
GitHub (full documentation, data, scripts): https://github.com/AstroMeters/Fireworks2023
Full PDF report with spectra: https://github.com/AstroMeters/Fireworks2023/blob/main/media/merged.pdf
Spectra gallery: https://github.com/AstroMeters/Fireworks2023/blob/main/gallery.md
YouTube recordings: https://www.youtube.com/playlist?list=PL3olITvRKy4xV_I5JRlAe6PY4d6_L131k
In the Czech Republic, from 2026, fireworks are strongly restricted. This means that similar experiments will be harder to repeat in the future.
Share