<?xml version="1.0" encoding="utf-8"?><feed xmlns="http://www.w3.org/2005/Atom" xml:lang="en"><generator uri="https://jekyllrb.com/" version="4.4.1">Jekyll</generator><link href="https://astrometers.eu/feed.xml" rel="self" type="application/atom+xml" /><link href="https://astrometers.eu/" rel="alternate" type="text/html" hreflang="en" /><updated>2026-05-29T22:18:00+00:00</updated><id>https://astrometers.eu/feed.xml</id><title type="html">AstroMeters</title><subtitle>AstroMeters specializes in high-quality astronomical components including precision focusers,  mount controllers, and environmental sensors. Open-source solutions designed by astronomy  enthusiasts for enhanced stargazing and astrophotography experiences.</subtitle><author><name>AstroMeters</name><email>roman.dvorak@astrometers.eu</email></author><entry xml:lang="en"><title type="html">Aurora Borealis over the Czech Republic on 19 January 2026 | AMASC01 all-sky camera</title><link href="https://astrometers.eu/blog/aurora-borealis-czech-republic-amasc01-all-sky-camera/" rel="alternate" type="text/html" title="Aurora Borealis over the Czech Republic on 19 January 2026 | AMASC01 all-sky camera" /><published>2026-01-24T00:00:00+00:00</published><updated>2026-04-08T10:11:41+00:00</updated><id>https://astrometers.eu/blog/aurora-borealis-czech-republic-amasc01-all-sky-camera</id><content type="html" xml:base="https://astrometers.eu/blog/aurora-borealis-czech-republic-amasc01-all-sky-camera/"><![CDATA[<h1 id="aurora-borealis-over-the-czech-republic-on-19-january-2026-captured-by-amasc01">Aurora Borealis over the Czech Republic on 19 January 2026 captured by AMASC01</h1>

<p>On the night of <strong>19 January 2026</strong>, a strong geomagnetic storm produced a spectacular <strong>aurora borealis</strong> visible across much of Europe, including the Czech Republic. This northern lights event was recorded by the <a href="/products/AMASC01/">AMASC01 all-sky camera</a>, a wide-field astronomical camera developed by AstroMeters for continuous night-sky monitoring.</p>

<div style="width: 72%; margin: 0 auto 1.5rem auto;">
  <video autoplay="" muted="" loop="" playsinline="" preload="metadata" poster="/images/blog/2026-01-19-amasc01-polarni-zare/image-20260119223453.jpg" style="display: block; width: 100%; height: auto; border-radius: 6px;">
    <source src="/images/blog/2026-01-19-amasc01-polarni-zare/allsky_20260119_timelapse.mp4" type="video/mp4" />
  </video>
</div>

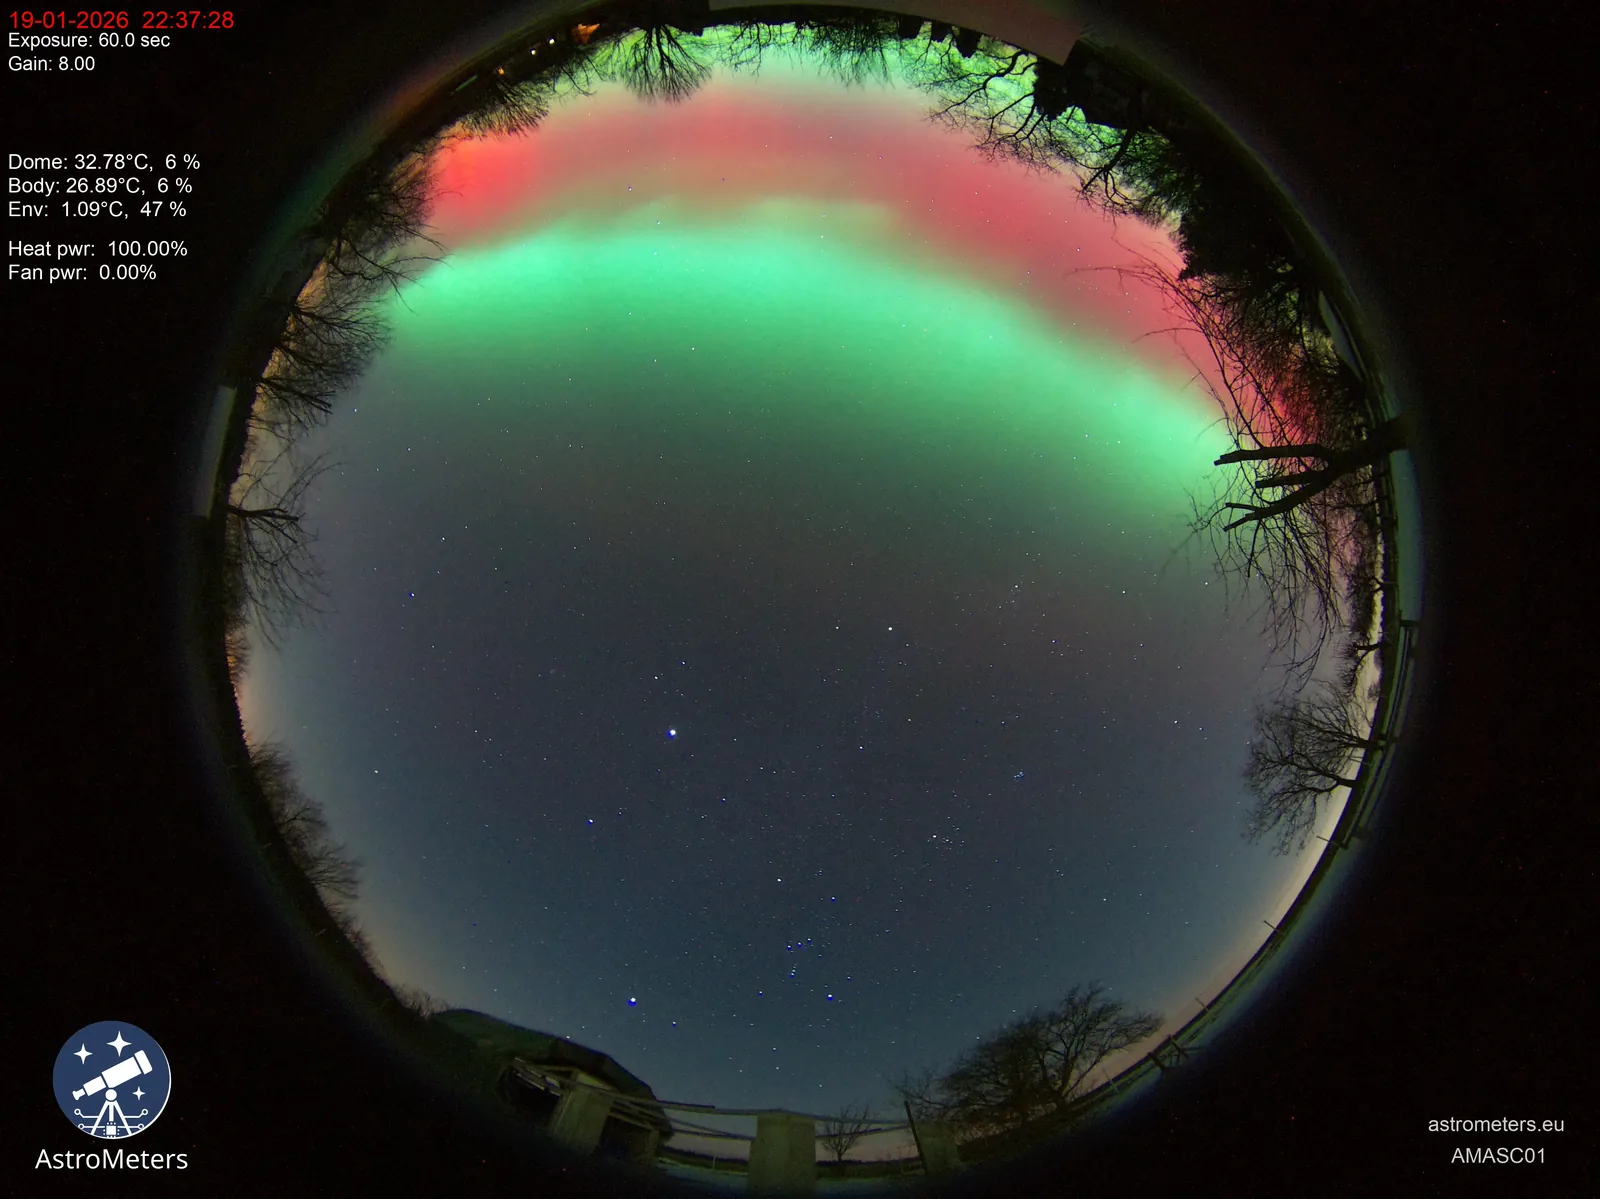
<p>The aurora appeared above the northern horizon shortly after 22:30 CET, forming a broad arc with distinct green and red auroral structures visible across the sky. Because strong auroras are relatively rare at this latitude, the event is a useful example of how an all-sky camera can document transient space-weather phenomena over Central Europe.</p>

<p>The full-night recording is available on YouTube: <a href="https://youtu.be/mBAFyZXwIJk">AMASC01 all-night aurora timelapse from 19 January 2026</a></p>

<h2 id="aurora-timelapse-keogram-and-time-evolution">Aurora timelapse, keogram and time evolution</h2>

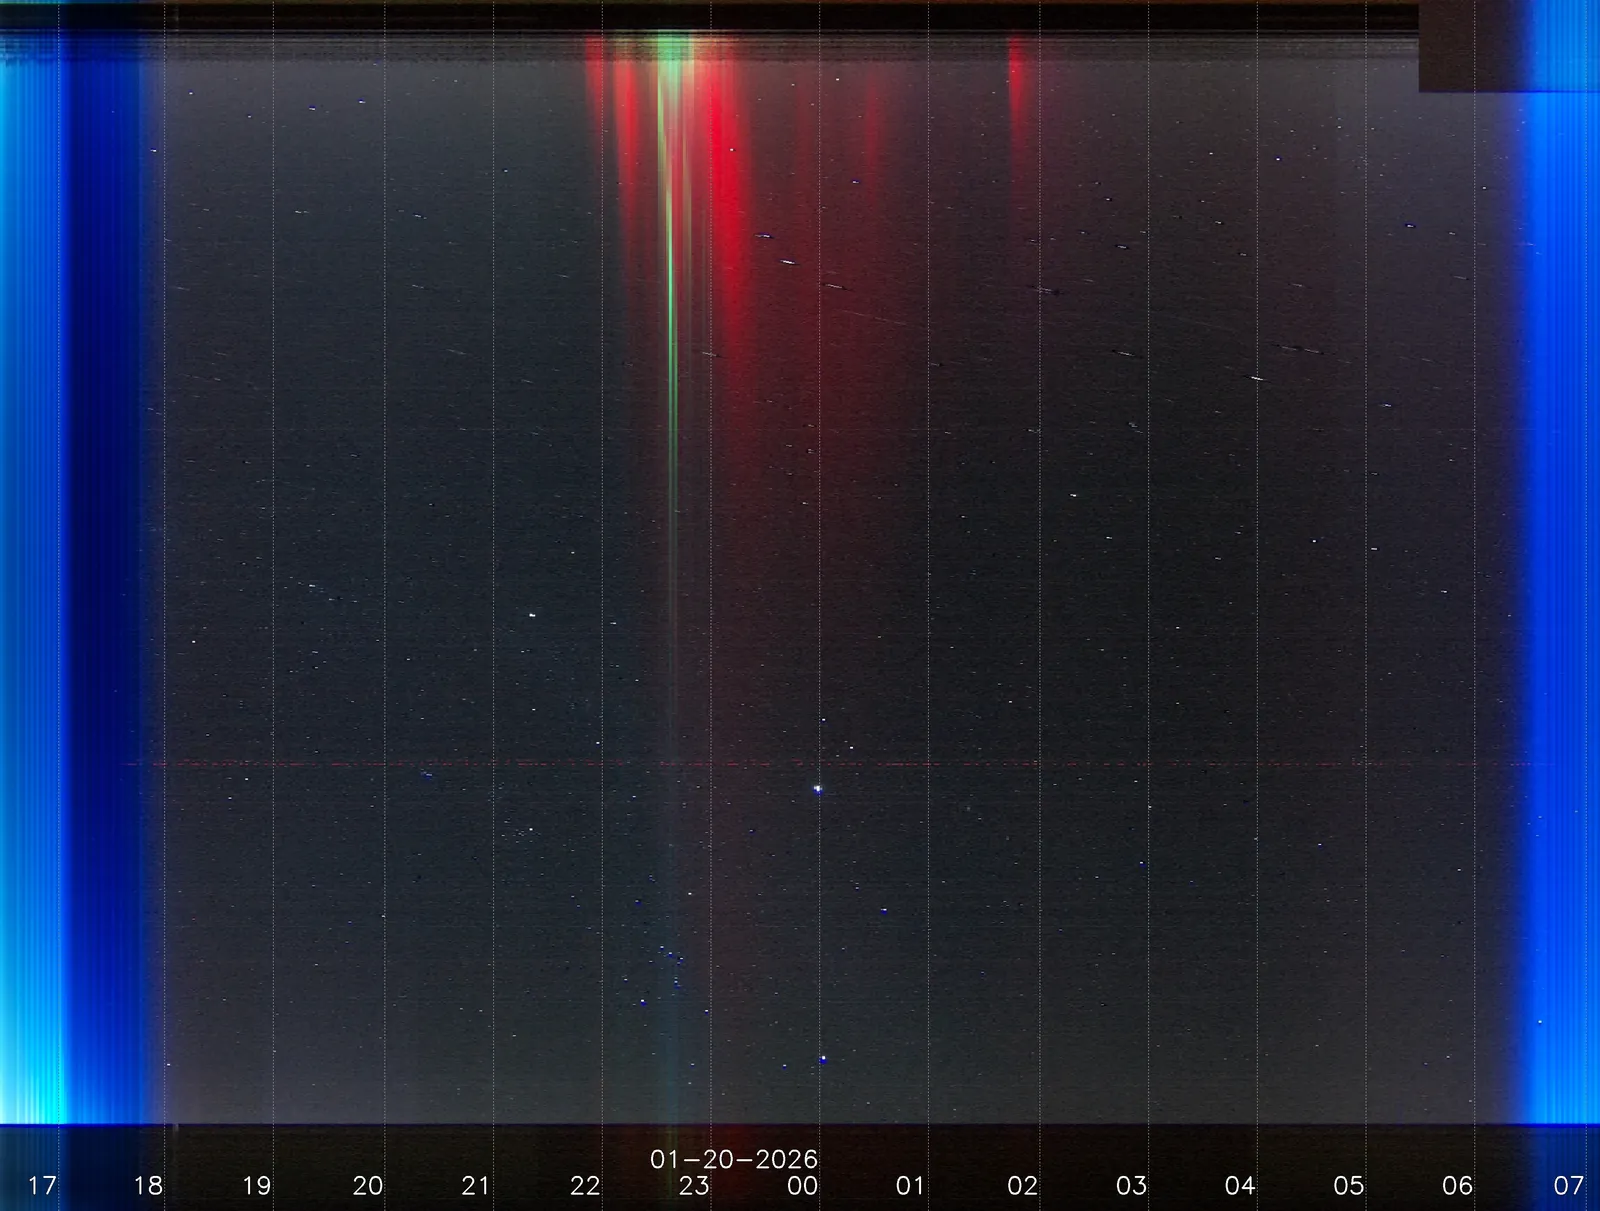
<p>The keogram below shows the temporal evolution of the aurora event and helps identify the onset, peak activity, and fading phase of the northern lights during the night.</p>

<div class="columns is-variable is-5 is-multiline">
  <div class="column is-6-desktop is-12-tablet">
    <figure>
      <img src="/images/blog/2026-01-19-amasc01-polarni-zare/image-20260119223625.jpg" alt="Aurora structure above the northern horizon captured by AMASC01" />
      <figcaption class="has-text-grey is-size-7 mt-2">
        Selected frame showing the auroral structure above the northern horizon.
      </figcaption>
    </figure>
  </div>
  <div class="column is-6-desktop is-12-tablet">
    <figure>
      <img src="/images/blog/2026-01-19-amasc01-polarni-zare/keogram-20260119.jpg" alt="Keogram of the aurora event recorded on January 19, 2026" />
      <figcaption class="has-text-grey is-size-7 mt-2">
        Keogram showing the time evolution of the aurora during the event.
      </figcaption>
    </figure>
  </div>
</div>

<h2 id="solar-activity-behind-the-january-2026-aurora">Solar activity behind the January 2026 aurora</h2>

<p>The aurora was triggered by a powerful X1.9-class solar flare that erupted on <strong>18 January 2026</strong> from an active region on the Sun. The flare produced a fast coronal mass ejection (CME) directed toward Earth.</p>

<p align="center">
  <img src="/images/blog/2026-01-19-amasc01-polarni-zare/cme.gif" alt="Animation of the coronal mass ejection associated with the January 2026 aurora event" width="78%" />
</p>
<p class="has-text-centered has-text-grey is-size-7">
  CME animation. Credits: ESA/NASA (SOHO) &amp; NASA (SDO)
</p>

<p>When the CME reached Earth about a day later, it triggered a strong geomagnetic storm (G4). During such events, the auroral oval expands toward lower latitudes, allowing auroras to be observed far outside the polar regions, including across Central Europe and the Czech Republic.</p>

<p>As a result, the aurora was visible in many Central European countries including Germany, Austria, Poland, and the Czech Republic, where it appeared as red and green arcs above the northern horizon.</p>

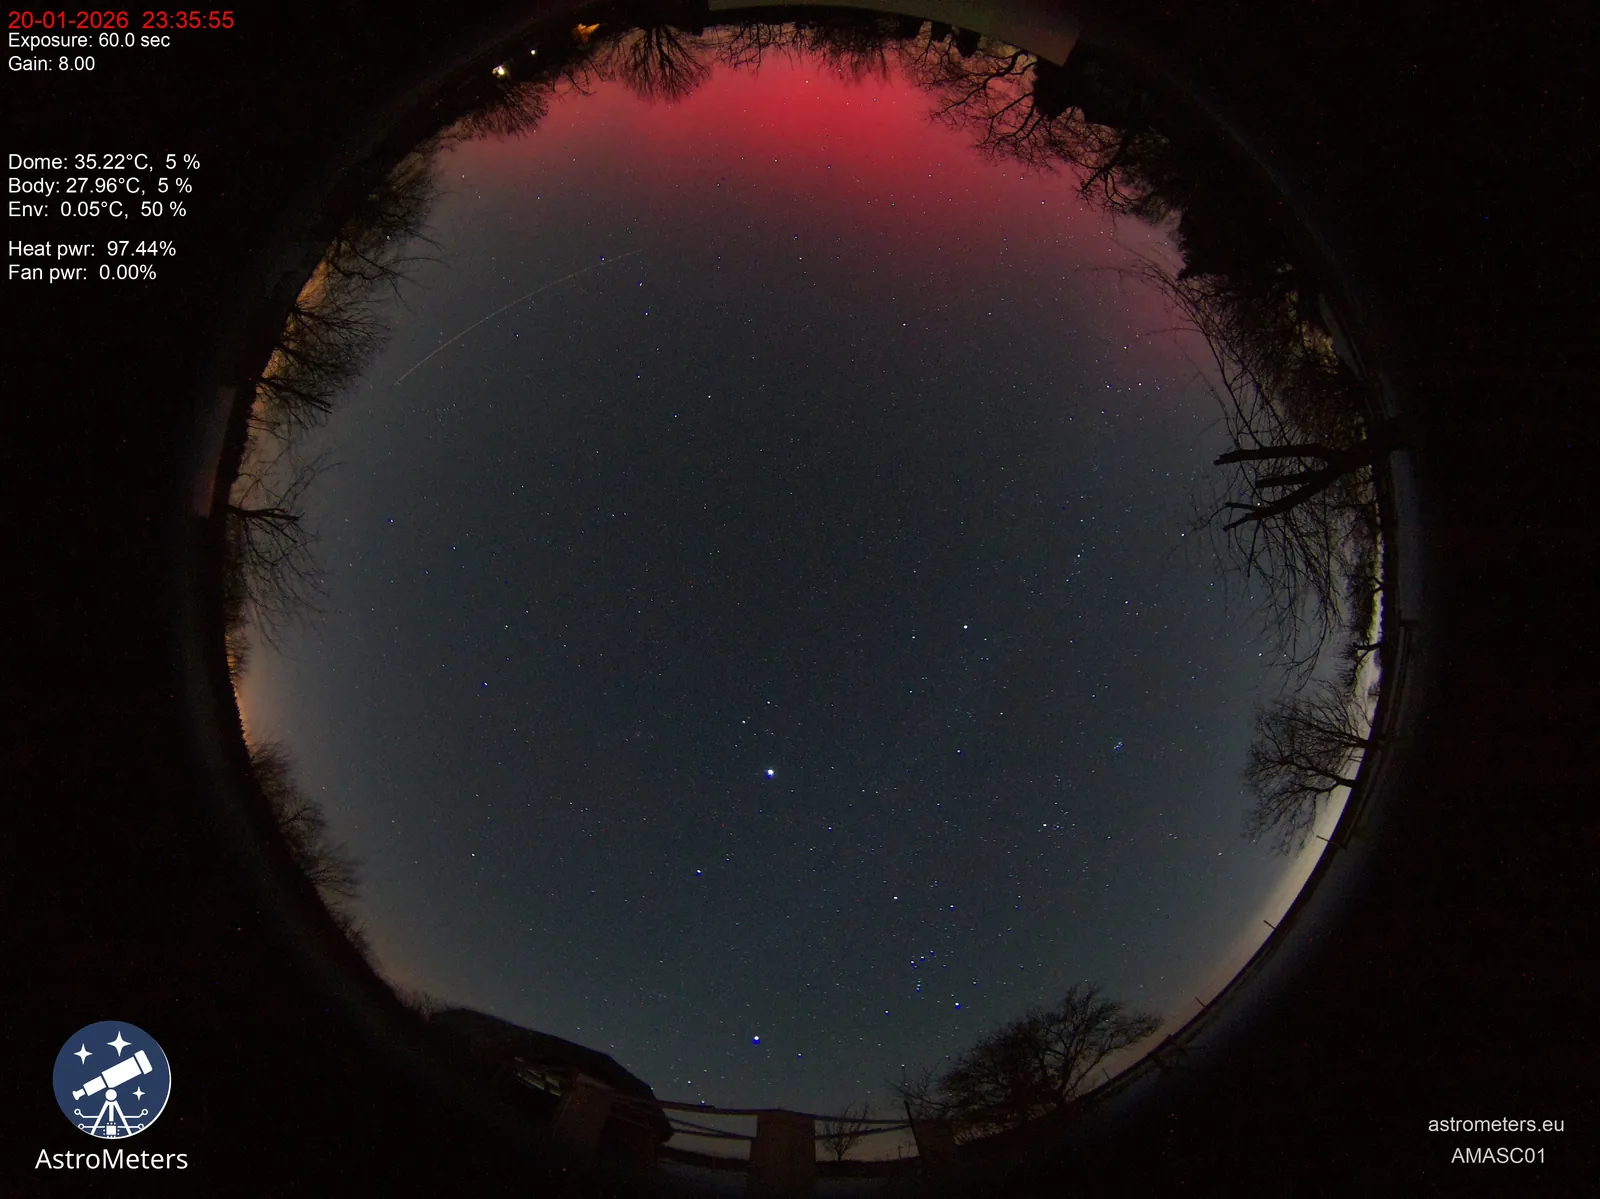
<p>The geomagnetic activity was so extensive that the aurora was still visible from the Czech Republic on the following night, <strong>20 January 2026</strong>. It was noticeably weaker than on the main event night, and only its red component was visible.</p>

<p align="center">
  <img src="/images/blog/2026-01-19-amasc01-polarni-zare/image-20260120233452.jpg" alt="Weaker red aurora visible from the Czech Republic on January 20, 2026" width="48%" />
</p>
<p class="has-text-centered has-text-grey is-size-7">
  Follow-up observation from the next night, showing only the weaker red auroral component.
</p>

<h2 id="amasc01-all-sky-camera-for-aurora-and-night-sky-monitoring">AMASC01 all-sky camera for aurora and night-sky monitoring</h2>

<p>The <a href="/products/AMASC01/">AMASC01 all-sky camera</a> is a fish-eye all-sky camera designed for continuous monitoring of the night sky. Using a fisheye optical system, it captures the entire sky dome and allows long-term recording of transient atmospheric and astronomical phenomena.</p>

<p>Such cameras are particularly useful for documenting events such as:</p>

<ul>
  <li>aurora borealis</li>
  <li>meteors and fireballs</li>
  <li>airglow</li>
  <li>changes in sky brightness and cloud cover</li>
</ul>

<p>The aurora recorded on <strong>19 January 2026</strong> demonstrates the capability of the <a href="/products/AMASC01/"><strong>AMASC01 all-sky camera</strong></a> to document rare atmospheric phenomena visible across the whole sky, including aurora borealis events in Central Europe.</p>

<p>More information about the camera and other astronomical instruments is available on the <a href="https://astrometers.eu">AstroMeters website</a>.</p>]]></content><author><name>Roman Dvořák</name></author><category term="aurora" /><category term="northern-lights" /><category term="AMASC01" /><category term="all-sky-camera" /><category term="Czech-Republic" /><category term="solar-storm" /><summary type="html"><![CDATA[The AMASC01 all-sky camera recorded a strong aurora borealis over the Czech Republic on 19 January 2026. See the northern lights time-lapse video, keogram, selected frames, and the solar activity behind the geomagnetic storm.]]></summary><media:thumbnail xmlns:media="http://search.yahoo.com/mrss/" url="https://astrometers.eu/images/blog/2026-01-19-amasc01-polarni-zare/image-20260119223453.jpg" /><media:content medium="image" url="https://astrometers.eu/images/blog/2026-01-19-amasc01-polarni-zare/image-20260119223453.jpg" xmlns:media="http://search.yahoo.com/mrss/" /></entry><entry><title type="html">Astrometers AMFOC01 - multipurpose device</title><link href="https://astrometers.eu/blog/multiple-usegase/" rel="alternate" type="text/html" title="Astrometers AMFOC01 - multipurpose device" /><published>2023-10-10T00:00:00+00:00</published><updated>2026-04-08T09:59:06+00:00</updated><id>https://astrometers.eu/blog/multiple-usegase</id><content type="html" xml:base="https://astrometers.eu/blog/multiple-usegase/"><![CDATA[<h1 id="hello">Hello!</h1>]]></content><author><name>AstroMeters Team</name></author><summary type="html"><![CDATA[Explore the versatile uses of the AMFOC01 astronomical focuser designed for both telescopic and optical applications. Learn how this multipurpose, open-source device enhances your observational capabilities with its cutting-edge technology and customizable features.]]></summary><media:thumbnail xmlns:media="http://search.yahoo.com/mrss/" url="https://astrometers.eu/images/docs.jpg" /><media:content medium="image" url="https://astrometers.eu/images/docs.jpg" xmlns:media="http://search.yahoo.com/mrss/" /></entry><entry xml:lang="en"><title type="html">Project: Measurement of optical spectra from fireworks</title><link href="https://astrometers.eu/blog/fireworks-optical-spectra/" rel="alternate" type="text/html" title="Project: Measurement of optical spectra from fireworks" /><published>2023-01-01T00:00:00+00:00</published><updated>2026-05-29T11:06:06+00:00</updated><id>https://astrometers.eu/blog/fireworks-optical-spectra</id><content type="html" xml:base="https://astrometers.eu/blog/fireworks-optical-spectra/"><![CDATA[<h2 id="a-new-years-eve-experiment">A New Year’s Eve Experiment</h2>

<p>New Year’s Eve is full of fireworks. People look at the sky and enjoy colors and light. This time, I had no plan I wanted to do something interesting. I had a simple idea. Fireworks are not only light. They are set of interesting elements. Each color comes from a different element. If I can split the light into a spectrum, I should be able to see these elements. So instead of just watching the fireworks, I decided to measure them. I built a simple spectrograph from parts I had or borrowed from my work. The goal was not to build a perfect instrument. The goal was to test if this idea works in real conditions.</p>

<p align="center"><img src="https://github.com/roman-dvorak/Fireworks2023/assets/5196729/0ded7bbc-ed8d-42df-afb6-dae9101b5f0a" width="65%" /></p>

<h2 id="building-the-setup">Building the Setup</h2>
<p>The setup was assembled using equipment available to us, allowing to conduct measurement without the need for purchasing expensive gear. This setup was chosen as “the best”, with the idea that it could be simplified for futhure measurement based on this experiences (check observed problems at end of this document).</p>

<ul>
  <li><strong>80/500 ED Telescope</strong>: An optical device with an 80 mm lens diameter and 500 mm focal length, optimized for capturing clear, detailed images.</li>
  <li><strong>Spectral Grating 100 lines/millimeter</strong>: Separates light into individual spectral lines for chemical element identification (<a href="https://www.rspec-astro.com/star-analyser/">SA-100</a>).</li>
  <li><strong>Monochromatic High-Speed Camera</strong>: Records 1000-800 frames per second, important for capturing fast-moving pyrotechnic events (<a href="https://www.krontech.ca/product/chronos-1-4-high-speed-camera/">Chronos 1.4 monochrome</a>).</li>
  <li><strong>Tripod</strong>: A sturdy tripod under the telescope allowing for quick aiming of the setup.</li>
  <li><strong>Finder Scope</strong>: A device for quickly aiming the telescope.</li>
  <li><strong>Computer with sufficient storage capacity</strong>: The camera produces a large amount of data; a 6-second recording is approximately 7 GB. Data was immediately uploaded via network to the connected computer.</li>
</ul>

<p align="center"><img src="https://github.com/roman-dvorak/Fireworks2023/assets/5196729/b99c4376-7233-4b5c-962b-cb13943ac42c" width="65%" /></p>

<p>The following images shows the attaching of a diffraction grating to the camera. Grating was screwed to the end of a C-mount to 1.25” barrel adapter. It ensures constant sensor-grating distance within the optical system.</p>

<div style="display: flex; gap: 1.5rem; align-items: flex-start; justify-content: center;">
  <img src="https://github.com/roman-dvorak/Fireworks2023/assets/5196729/c4ff3cd2-e0c2-44e5-9d8e-66ef24d8ffd8" style="height: 200px; width: auto;" />
  <img src="https://github.com/roman-dvorak/Fireworks2023/assets/5196729/514a96e6-aef7-419b-b3b0-fe0772c6c94e" style="height: 200px; width: auto;" />
</div>

<h2 id="cold-night-above-prague">Cold Night Above Prague</h2>

<p>The experiment took place during New Year’s Eve, from a higher building in Prague.</p>

<p>It was cold. The sky was full of random explosions. Fireworks are difficult targets:</p>

<ul>
  <li>They appear suddenly</li>
  <li>They move fast</li>
  <li>They change brightness very quickly</li>
  <li>They disappear in a moment</li>
</ul>

<p>The camera was running at high speed (up to ~1000 FPS). It recorded RAW12 data continuously. Each short recording was large. A few seconds could take several gigabytes. Data was sent directly to a computer over the network. Most of the data is useless. But sometimes, everything works. The firework is in the field of view, the focus is correct, and the spectrum is visible. These frames are the result.</p>

<h2 id="from-raw-data-to-spectra">From Raw Data to Spectra</h2>

<p>After the night, the real work started. The RAW12 format is efficient, but not easy to use. Two pixels are stored in three bytes. So the first step was conversion.I used a Python script to convert RAW12 files into TIFF images. This process is slow, but necessary. Then I used FFmpeg to create preview videos. This made it easier to search for good frames. You can see these videos here:</p>

<div style="position: relative; padding-bottom: 56.25%; height: 0; overflow: hidden; margin-bottom: 1.5rem;">
  <iframe src="https://www.youtube.com/embed/tPwrmtYvqSc" style="position: absolute; top: 0; left: 0; width: 100%; height: 100%; border: 0;" allowfullscreen="" loading="lazy"></iframe>
</div>

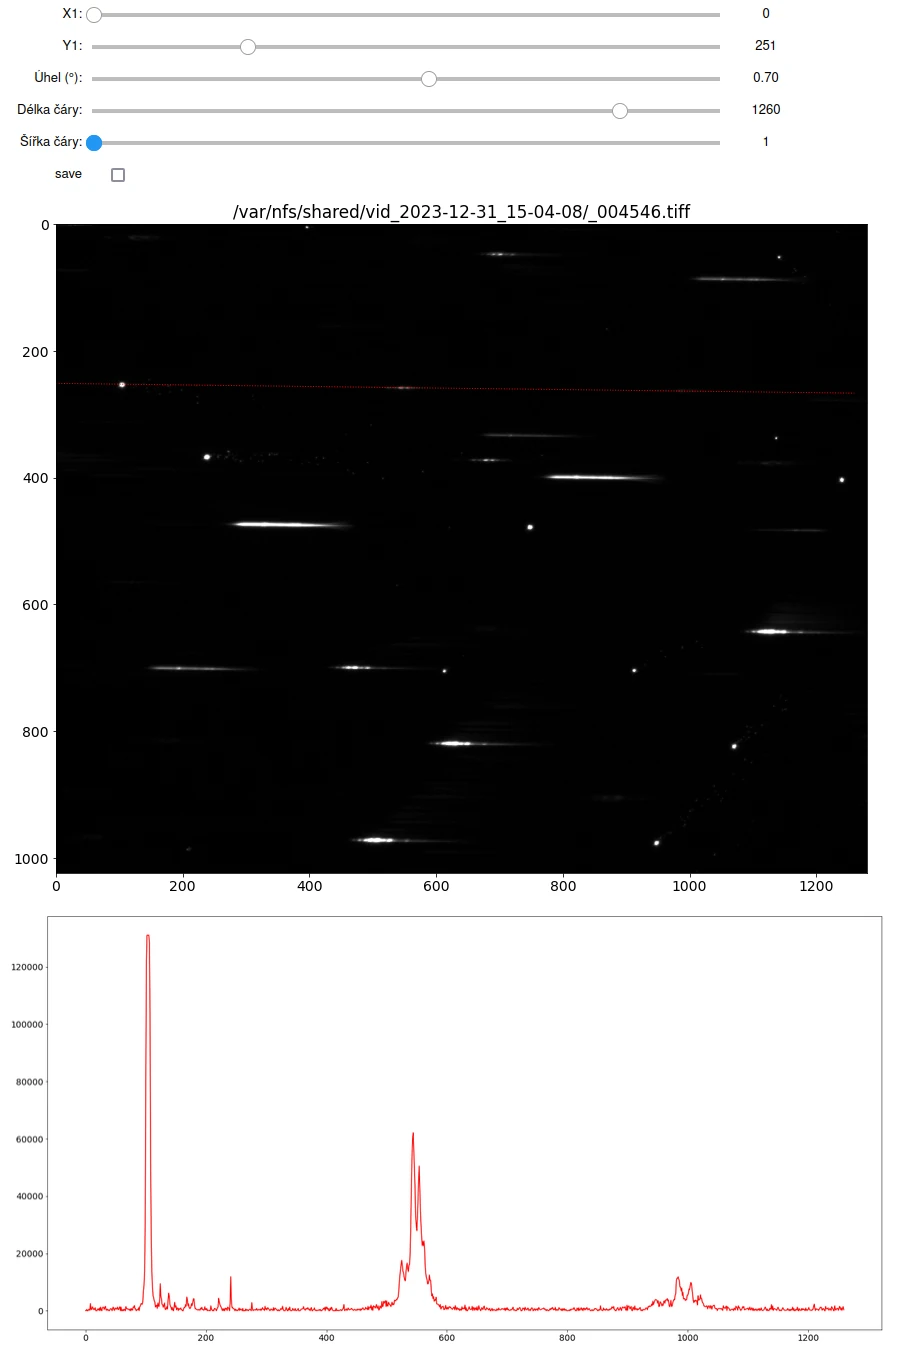
<p>After that, I manually selected frames with visible spectra. The analysis was done in a Jupyter Notebook. The workflow was simple and interactive. I selected a line across the spectrum. Then I calculated intensity along this line. Finally, I converted pixel position into wavelength. At this moment, the fireworks stopped being just images. They became data.</p>

<h2 id="calibration">Calibration</h2>

<p>To convert pixels to wavelength, I used geometry of the setup.</p>

<p>Important parameters were:</p>

<ul>
  <li>Grating density (100 lines/mm)</li>
  <li>Distance between grating and sensor (not perfectly known)</li>
  <li>Pixel size</li>
</ul>

<p>To improve accuracy, I used known light sources:</p>

<ul>
  <li>Sodium street lamp</li>
  <li>Green laser (532 nm)</li>
</ul>

<p>Calibration works, but it is not perfect. This part needs improvement.</p>

<h2 id="what-the-fireworks-reveal">What the Fireworks Reveal</h2>

<p>When looking at the spectra, the result is clear. Fireworks do not produce continuous light. They produce lines. Each element has its own pattern:</p>

<ul>
  <li>Sodium → yellow</li>
  <li>Strontium → red</li>
  <li>Barium → green</li>
  <li>Copper → blue</li>
</ul>

<p>This confirms that the method works. However, identification is still manual. I do not have a full spectral database yet.</p>

<h2 id="problems-during-the-experiment">Problems During the Experiment</h2>

<p>The experiment also showed many problems. Focusing was difficult. The depth of field was very small. Aiming was also difficult. The telescope has high magnification and a narrow field of view. Exposure was another issue. Some parts were too bright, others too dark. The camera also needed time to save data. During this time, new events were missed.  All these problems are important. They show what needs to be improved.</p>

<h2 id="results">Results</h2>

<p>The main result is simple. The method works. Even with a simple setup, it is possible to measure spectra of fireworks. The data is usable and shows clear emission lines. But the process is not automated. It still requires manual work.</p>

<p align="center">
  <img src="/images/blog/2023-01-01-fireworks-spectra/spectrum_analysis.png" width="70%" alt="Spectrum analysis tool — raw frame with spectral lines and intensity profile" />
</p>
<p class="has-text-centered has-text-grey is-size-7">Interactive analysis tool: raw frame with spectral lines (top) and the extracted intensity profile (bottom).</p>

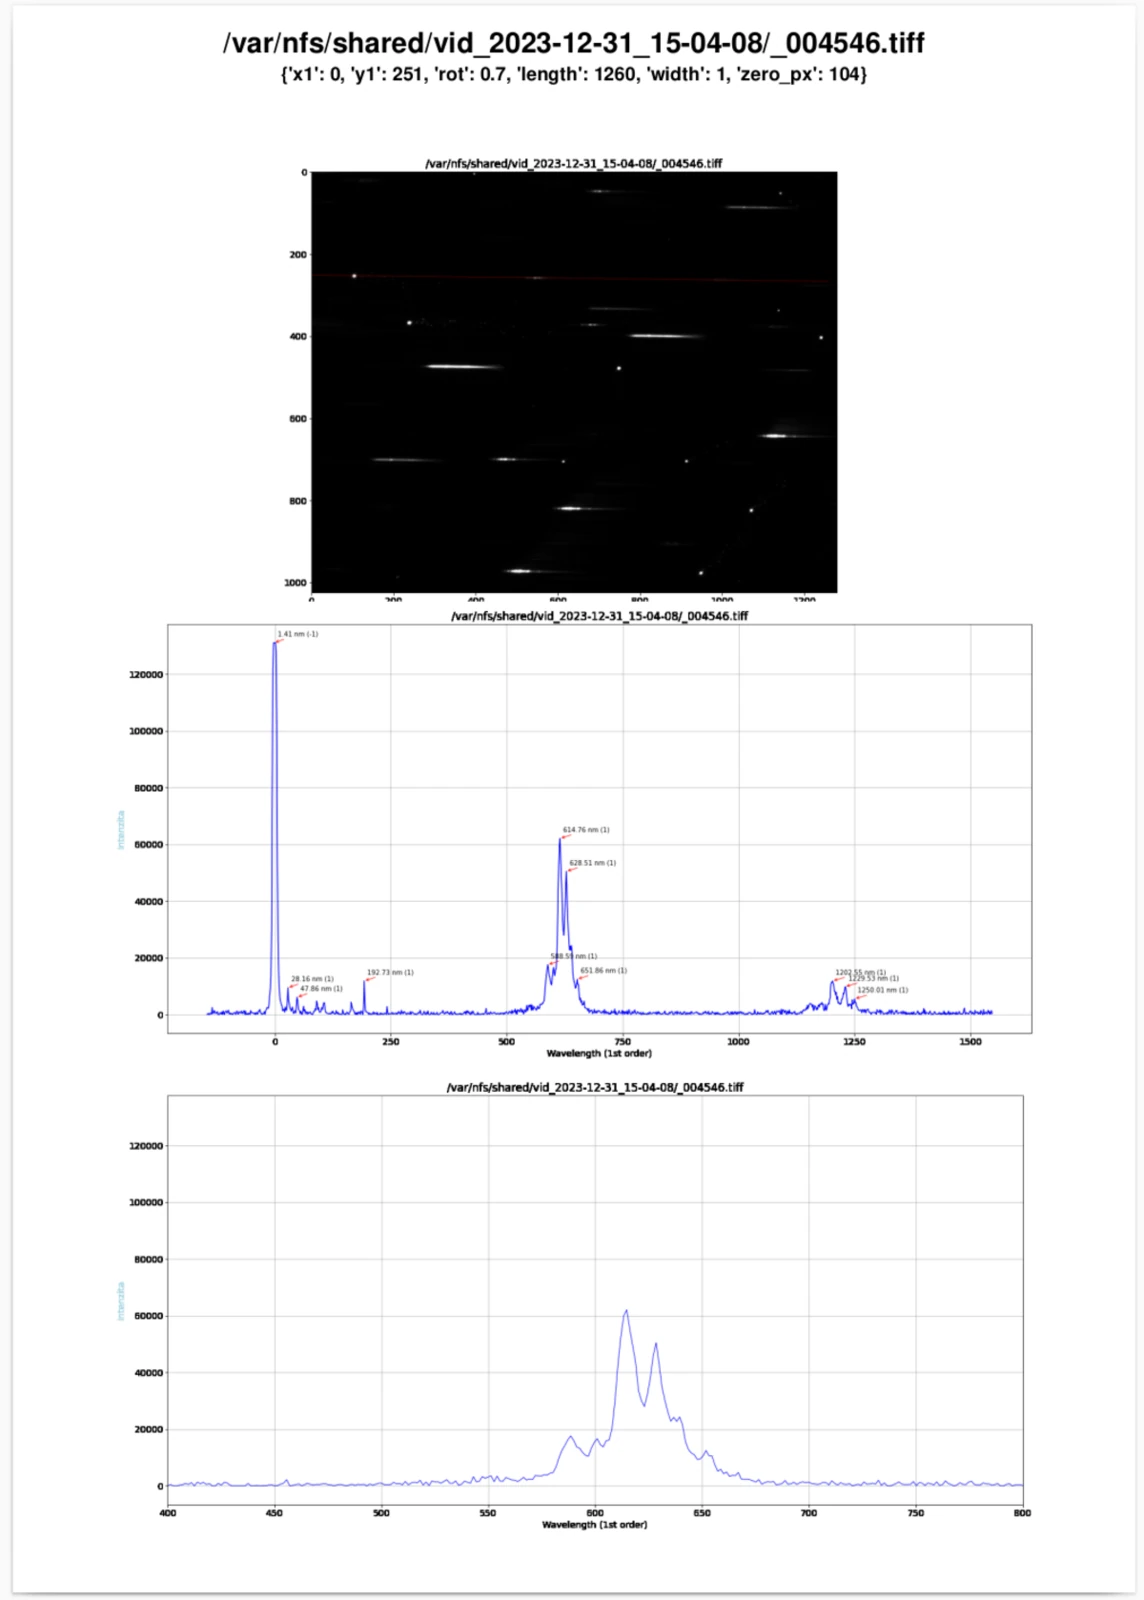
<p>After extracting the intensity profile along the spectral line, the pixel positions were converted to wavelengths using the calibration. The resulting spectrum clearly shows individual emission peaks. The two dominant groups correspond to strontium lines in the red region (~614 nm, ~628 nm) and a strong sodium doublet near 589 nm.</p>

<h2 id="next-steps">Next Steps</h2>

<p>There are many ways to improve the system. Better aiming would help a lot. Maybe a tracking mount. Better diffraction grating would improve resolution. Faster data handling would reduce missed events. Better calibration is also needed. And finally, a spectral database is required for automatic identification.</p>

<p align="center">
  <img src="/images/blog/2023-01-01-fireworks-spectra/spectrum_calibrated.png" width="75%" alt="Calibrated spectrum with labeled emission line wavelengths" />
</p>
<p class="has-text-centered has-text-grey is-size-7">Calibrated spectrum with labeled emission lines — visible peaks correspond to barium (green) and strontium (red) emission lines.</p>

<h2 id="related-links">Related Links</h2>

<ul>
  <li>
    <p>GitHub (full documentation, data, scripts):
<a href="https://github.com/AstroMeters/Fireworks2023">https://github.com/AstroMeters/Fireworks2023</a></p>
  </li>
  <li>
    <p>Full PDF report with spectra:
<a href="https://github.com/AstroMeters/Fireworks2023/blob/main/media/merged.pdf">https://github.com/AstroMeters/Fireworks2023/blob/main/media/merged.pdf</a></p>
  </li>
  <li>
    <p>Spectra gallery:
<a href="https://github.com/AstroMeters/Fireworks2023/blob/main/gallery.md">https://github.com/AstroMeters/Fireworks2023/blob/main/gallery.md</a></p>
  </li>
  <li>
    <p>YouTube recordings:
<a href="https://www.youtube.com/playlist?list=PL3olITvRKy4xV_I5JRlAe6PY4d6_L131k">https://www.youtube.com/playlist?list=PL3olITvRKy4xV_I5JRlAe6PY4d6_L131k</a></p>
  </li>
</ul>

<h2 id="update">Update</h2>

<p>In the Czech Republic, from 2026, fireworks are strongly restricted. This means that similar experiments will be harder to repeat in the future.</p>]]></content><author><name>Roman Dvořák</name></author><category term="spectroscopy" /><category term="fireworks" /><category term="optics" /><category term="spectra" /><summary type="html"><![CDATA[A project focused on capturing and analyzing optical emission spectra of fireworks using a diffraction grating spectrograph. The recorded spectra reveal characteristic emission lines of metals used in pyrotechnic compositions.]]></summary><media:thumbnail xmlns:media="http://search.yahoo.com/mrss/" url="https://astrometers.eu/images/blog/2023-01-01-fireworks-spectra/hero.jpg" /><media:content medium="image" url="https://astrometers.eu/images/blog/2023-01-01-fireworks-spectra/hero.jpg" xmlns:media="http://search.yahoo.com/mrss/" /></entry></feed>